usingNeuroAnalyzerimportCairoMakie# Quarto sets a default figure size (672 × 480 px), which overrides the sizes of# NeuroAnalyzer figures: remove itdelete!(CairoMakie.Makie.CURRENT_DEFAULT_THEME, :resolution)usingStatisticsNeuroAnalyzer.progress_bar =false# preprocessed recording, EEG channels only, first 10 secondseeg =load_neuro("files/eeg/eeg.hdf")eeg =keep_channel(eeg; ch ="eeg")eeg =crop(eeg; seg = (0, 10))
Often only a part of matrix data needs to be analyzed, e.g. a time-frequency region of a spectrogram or a region of a topographic map. NeuroAnalyzer provides two functions for this:
seg_select(): interactive selection of a region of a matrix (returns its coordinates or values),
seg_extract(): extraction of a region given by its coordinates or by a threshold.
Preparing the Data
Any matrix can be used. Here, the spectrogram of O1 (powers, not dB, so that they can be averaged); the rows of the matrix are frequencies and the columns are time points:
sp = NeuroAnalyzer.spectrogram(eeg; ch ="O1", db =false)m = sp.p[:, :, 1, 1]println("Matrix size: ", size(m), " (frequencies × time points)")plot_spectrogram(sp.t, sp.f, m; db =false, flim = (0, 40), xlabel ="Time [s]", ylabel ="Frequency [Hz]", title ="Spectrogram, O1")
Matrix size: (129, 89) (frequencies × time points)
The row and column indices of given frequencies and times are found using vsearch(), which returns the index of the nearest value:
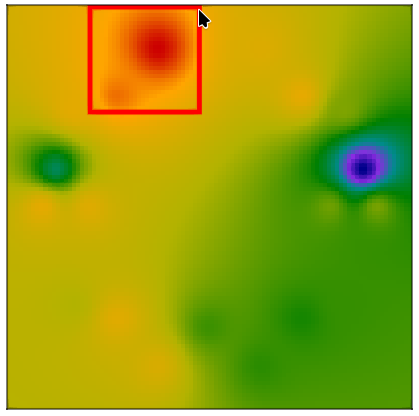
seg_select() opens a window with the matrix, in which a segment is selected using the mouse; the default shape is rectangular:
seg_select(m)
Tip: place the corners of the selection using left clicks; a right click undoes the last action. Press Enter when ready or close the window to cancel.
The function returns the coordinates of the segment: the row and column of the upper-left corner and the row and column of the bottom-right corner, e.g.:
(1, 21, 26, 48)
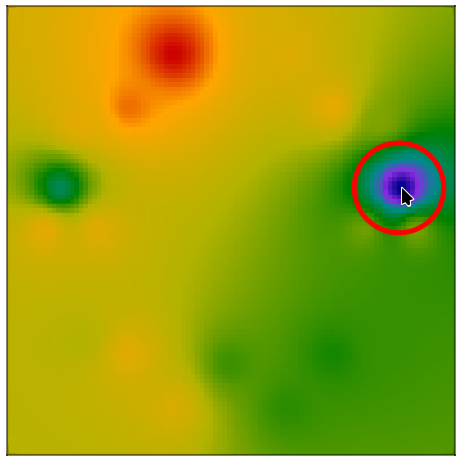
To select a circular segment, use shape = :c; a left click places the center of the selection and the mouse wheel changes its size:
seg_select(m; shape =:c)
For a circular segment, the coordinates are the center (row and column) and a point on its edge (row and column).
Other options:
shape = :p: select a single point (returns its row and column),
extract = true: return the values of the segment instead of its coordinates,
v = true: return the values as a vector (always true for circular segments).
Extracting Segments
seg_extract() returns the values of a segment given by its coordinates. The power of the 4–8 Hz range between 2 and 4 seconds (rows r1:r2, columns c1:c2):
With v = true the segment is returned as a vector (the rows of the matrix one after another):
s =seg_extract(m, seg; v =true)println("Vector length: ", length(s))
Vector length: 100
A circular segment (c = true) is always returned as a vector; the coordinates are the center (row, column) and a point on the edge (row, column). A circle of radius 3 around 6 Hz at the 40th time point:
s =seg_extract(m, (7, 40, 10, 40); c =true)println("Number of values: ", length(s))
Number of values: 29
Extracting Segments by Threshold
Without coordinates, seg_extract() selects all elements of the matrix that meet a threshold, using the same rules as the thresholding of plots (:eq, :neq, :geq, :leq, :g, :l, :in, :bin). It returns a named tuple with the Cartesian coordinates of the selected elements (idx) and a Boolean map of the segment (bm). The elements with power ≥ 5 μV²/Hz:
th =seg_extract(m; threshold =5, threshold_type =:geq)println("Number of elements: ", length(th.idx))# frequencies and times of the selected elementsfrq = sp.f[getindex.(th.idx, 1)]t = sp.t[getindex.(th.idx, 2)]println("Frequency range: ", extrema(frq), " Hz")println("Mean power: ", round(mean(m[th.idx]); digits =2), " μV²/Hz")
Number of elements: 78
Frequency range:    (1.0, 10.0) Hz
Mean power:         7.95 μV²/Hz
The same region can be marked on a heatmap:
f_idx =vsearch(40, sp.f)plot_heatmap(m[1:f_idx, :]; x = sp.t, y = sp.f[1:f_idx], xlabel ="Time [s]", ylabel ="Frequency [Hz]", title ="Spectrogram, O1: power ≥ 5 μV²/Hz", threshold =5, threshold_type =:geq)